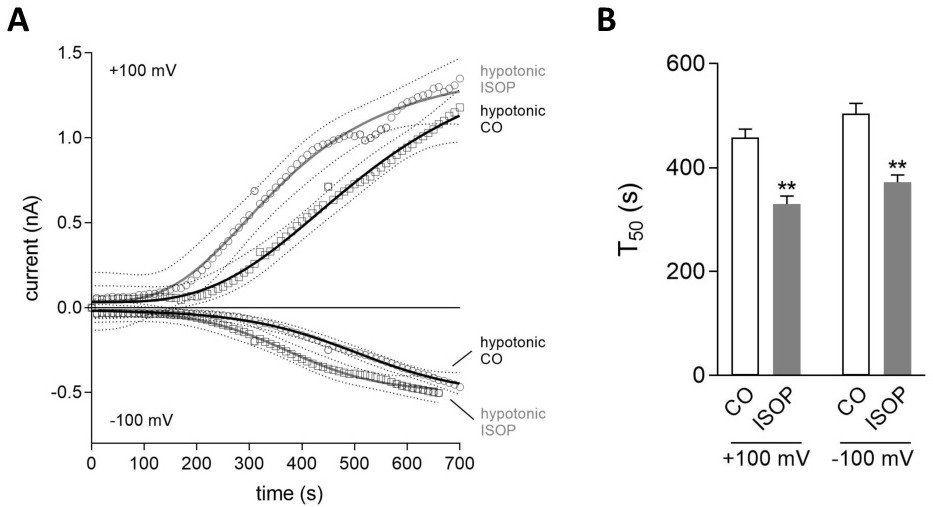
Fig. 4. Activation of ICl,swell in the presence of isoproterenol (ISOP). (A) Time course of ICl,swell activation under hypotonic conditions in the absence (control, CO; n=7) and presence of 1 µM isoproterenol (ISOP; n=6). Each circle represents the current obtained every 10 seconds at -100 mV (inward currents, lower traces) and +100 mV (outward currents, upper traces). Dotted lines denote 95% confidence intervals. Data were fitted by a sigmoidal Boltzmann function which was used to calculate the time to reach the half-maximal current activation (T50). (B) T50 values for outward currents at +100 mV and inward currents at -100 mV in the absence (control, CO) and presence of 1 µM ISOP. Data were determined from individual sigmoidal Boltzmann fits. Means±SEM. Asterisks denote significant difference from the respective control value. ** p<0.01.